Optimizing Food Bank Resources in the DC Metro Area
Optimizing Food Resources with Data-Driven Analysis
As a data science consultant, I recently had the opportunity to collaborate with the Capital Area Food Bank (CAFB) on optimizing their operations across the DC metro area. CAFB is the largest food bank in the mid-Atlantic region, distributing over 30 million meals annually to combat food insecurity for 380,000 individuals.
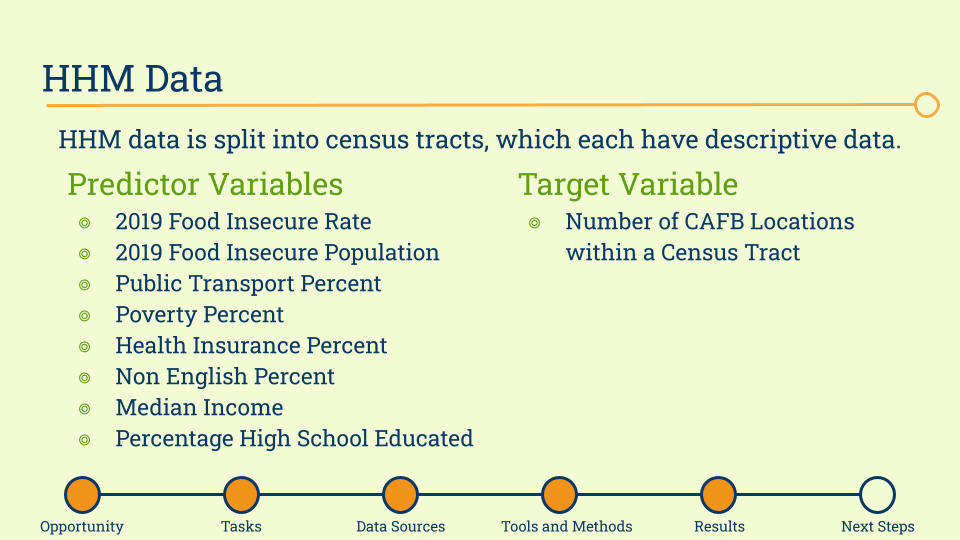
The main dataset guiding our analysis was CAFB's unique "hunger heat map" - a comprehensive CSV tracking food insecurity metrics across census tracts. Leveraging pandas for data manipulation and statsmodels.api for regression modeling, our team analyzed this data to identify areas with the greatest opportunity for improvement.
Results:
Our Python linear regression produced residuals highlighting census tracts that were over or under-resourced compared to model predictions. Mapping these outliers uncovered five tracts with significantly lower partner presence than expected given area statistics. These represented high priority zones for CAFB to strategically expand services.
Conversely, tracts with an abnormally high number of partners could be candidates for reallocation to more critical regions. However, positive residuals don't necessarily indicate inefficiency as some partners like healthcare providers have distinct service functions.
Combining spatial visualization with rigorous quantitative modeling enabled us to provide CAFB with data-backed recommendations on enhancing their community impact. I was continually impressed by their team's passion and collaborative approach to this mission-critical work.

Breaking down the data:
A key task was developing a predictive model to estimate the optimal number of CAFB partner locations within each tract. We selected predictor variables like public transportation access, poverty rates, and education levels that would indicate food insecurity and need for resources.

